Lab 2: IMU
In this lab I configured the intertial measurement unit and analyzed accelerometer and gyroscope readings.
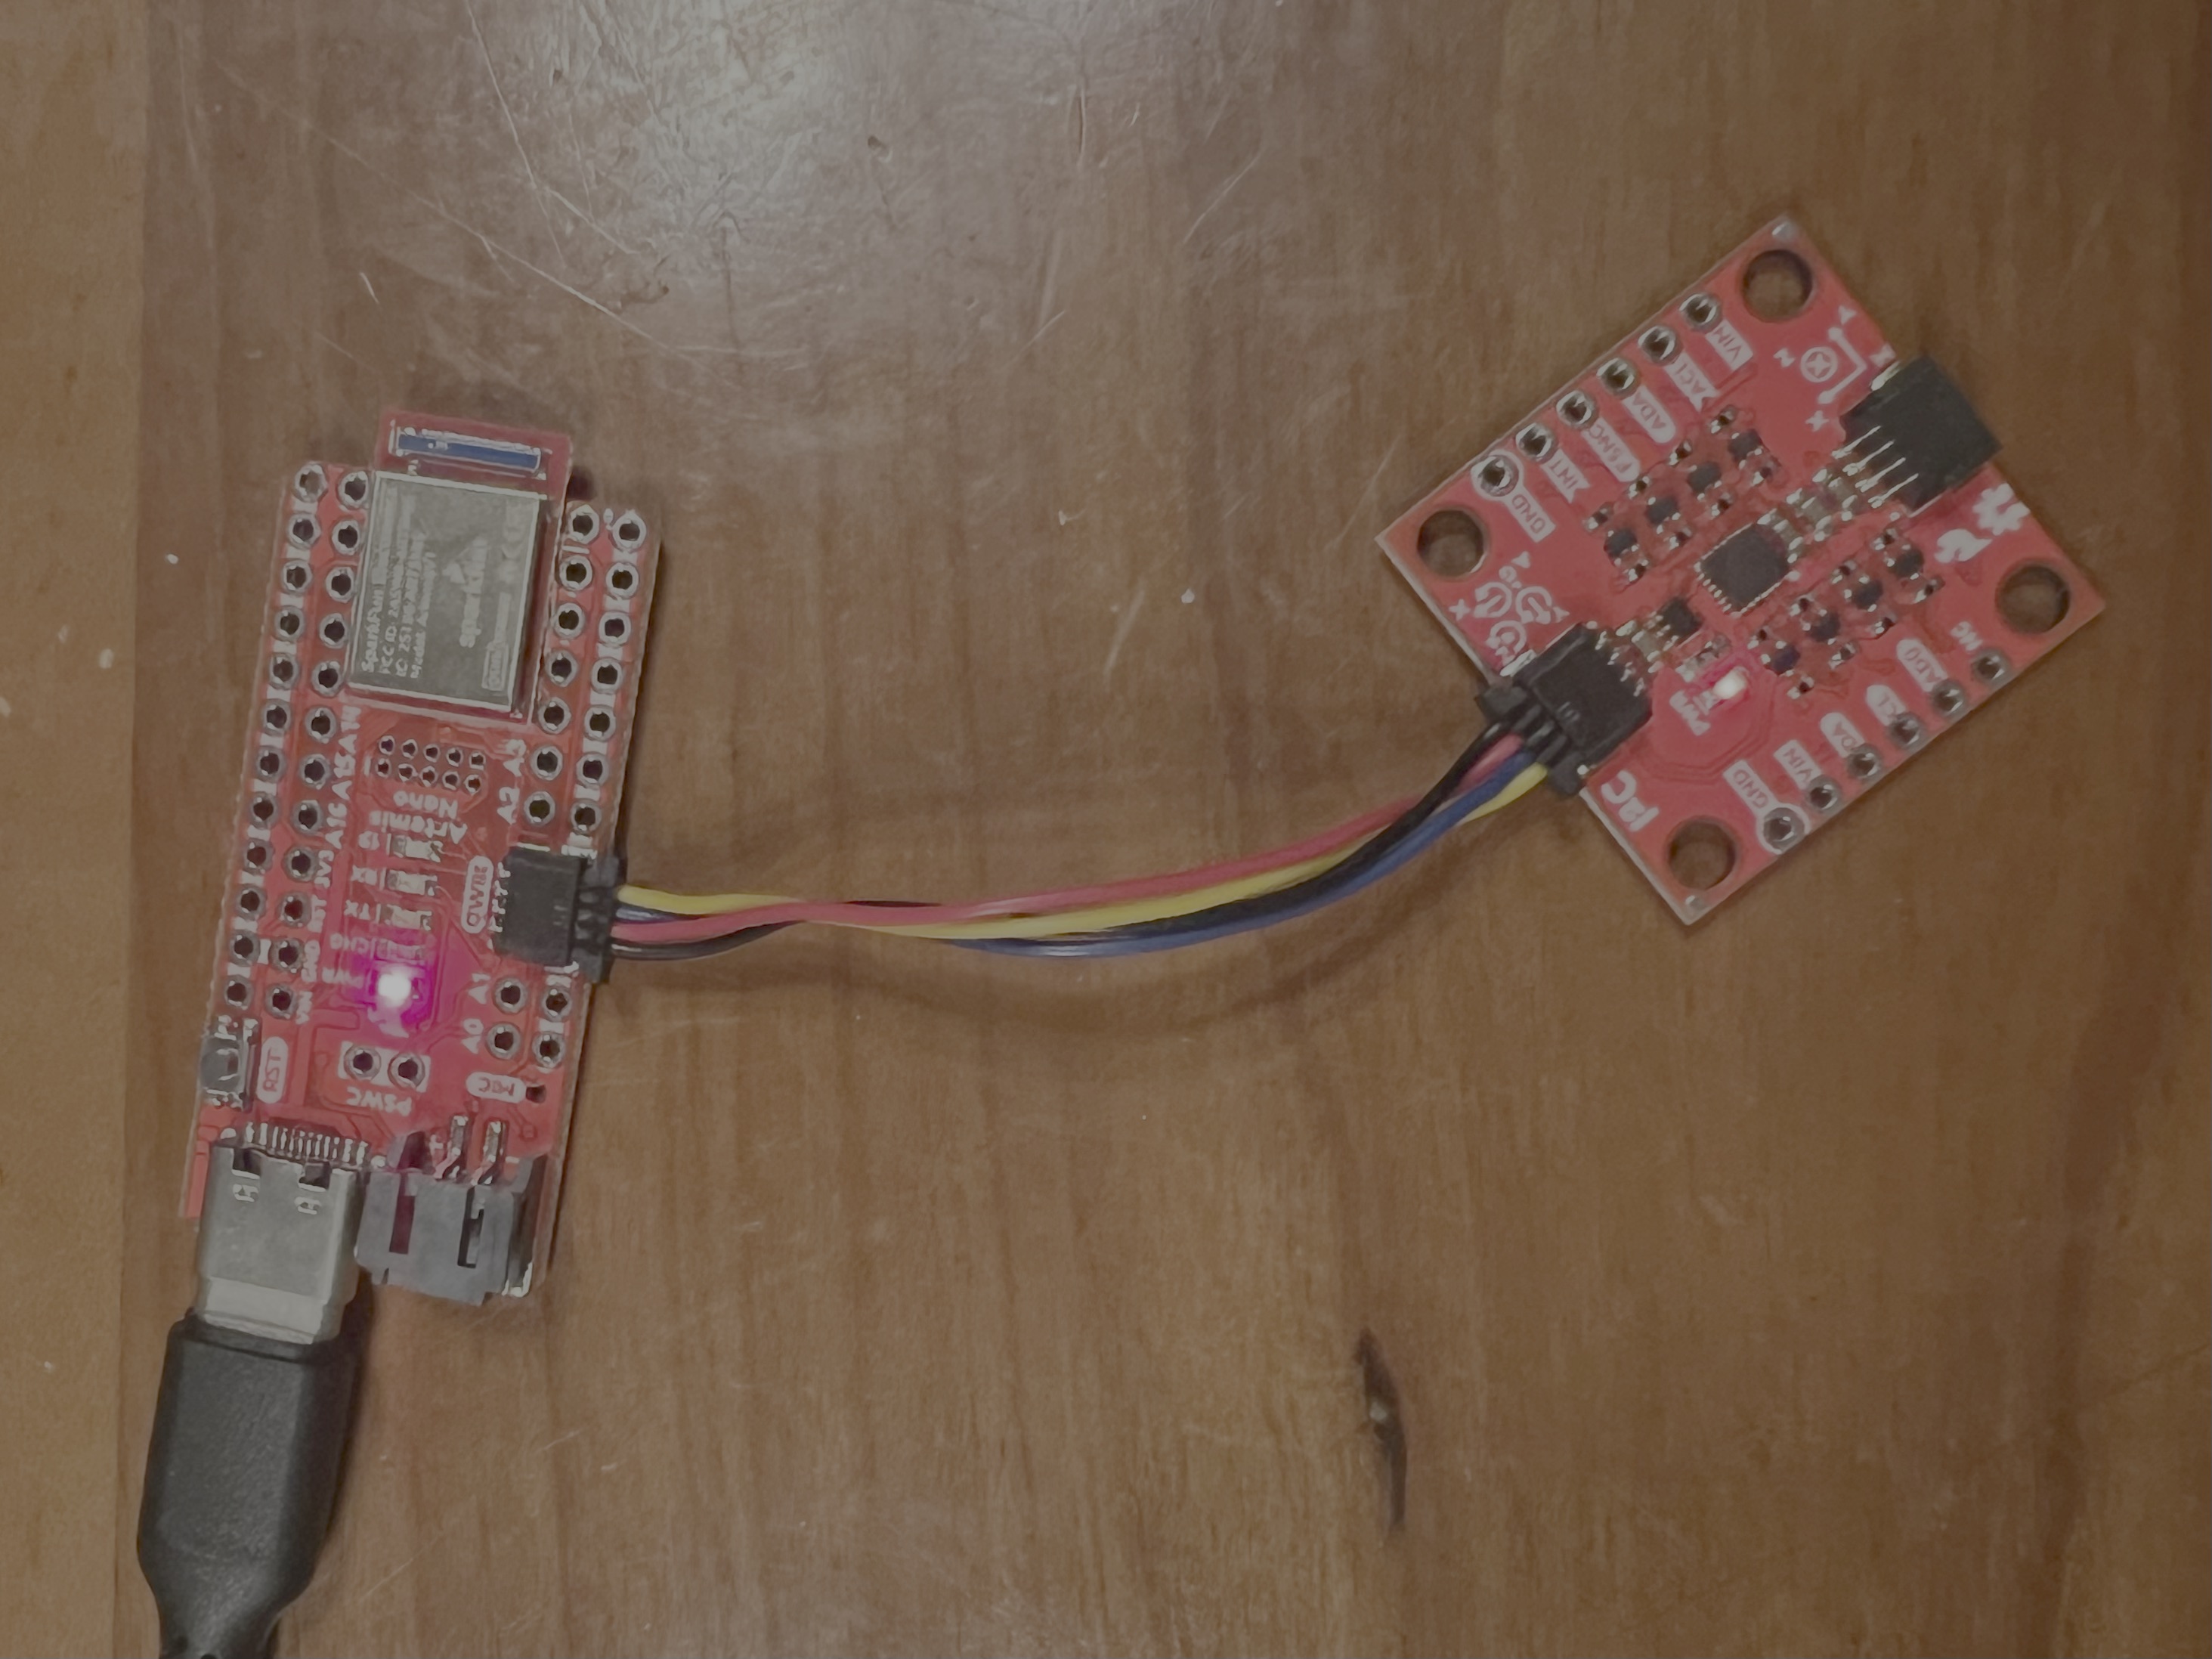
Set up the IMU
To set up the IMU, I installed the SparkFun IMU Arduino Library and connected the IMU to the Artemis board using QWIIC connectors.
Example Code
I tested the IMU using an Arduino example sketch. AD0_VAL is the last bit of the I2C address. It represents whether the ADR jumper is closed. It’s 0 when the jumper is closed and 1 when it isn’t. It should be 1 for this lab because the jumper isn’t soldered close.
Running the Example1_Basics sketch:
The Serial Monitor shows acceleration, gyroscope, and temperature data. The orientation of the axes is indicaated on the IMU. As I accelerate the sensor in the positive x, y, and z direction relative to gravity, the respective acceleration value increases. As I accelerate in the negative direction, it decreases. As I rotate the sensor in the positive x, y, and z direction, the respective gyroscope value increases. As I rotate in the negative direction, it decreases.
Blink LED on Start-up
I added a loop that blinks the LED three times slowly on start-up as a visual indication that the board is running.
for (int i=0; i<3; i++){
    digitalWrite(LED_BUILTIN, HIGH);  // turn the LED on (HIGH is the voltage level)
    delay(1000);                      // wait for a second
    digitalWrite(LED_BUILTIN, LOW);   // turn the LED off by making the voltage LOW
    delay(1000);                      // wait for a second
}
Accelerometer
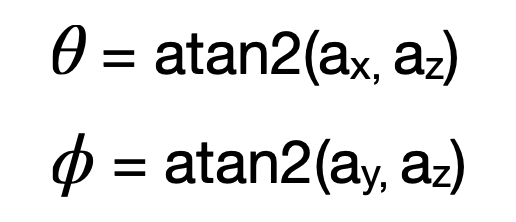
Calculating Pitch and Roll
I used the following equation from the lecture slides to calculate pitch and roll. I multiplied the value by 180/pi to convert from radians to degrees.
Arduino code:
acc_pitch = atan2(myICM.accX(), myICM.accZ()) * 180 / M_PI;
acc_roll = atan2(myICM.accY(), myICM.accZ()) * 180 / M_PI;
I created a function to print the pitch and roll to the serial monitor as well.
void printPitchRoll(float pitch, float roll) {
  SERIAL_PORT.print("Pitch: ");
  SERIAL_PORT.print(pitch);
  SERIAL_PORT.print("  |  ");

  SERIAL_PORT.print("Roll: ");
  SERIAL_PORT.print(roll);
  SERIAL_PORT.println();
}
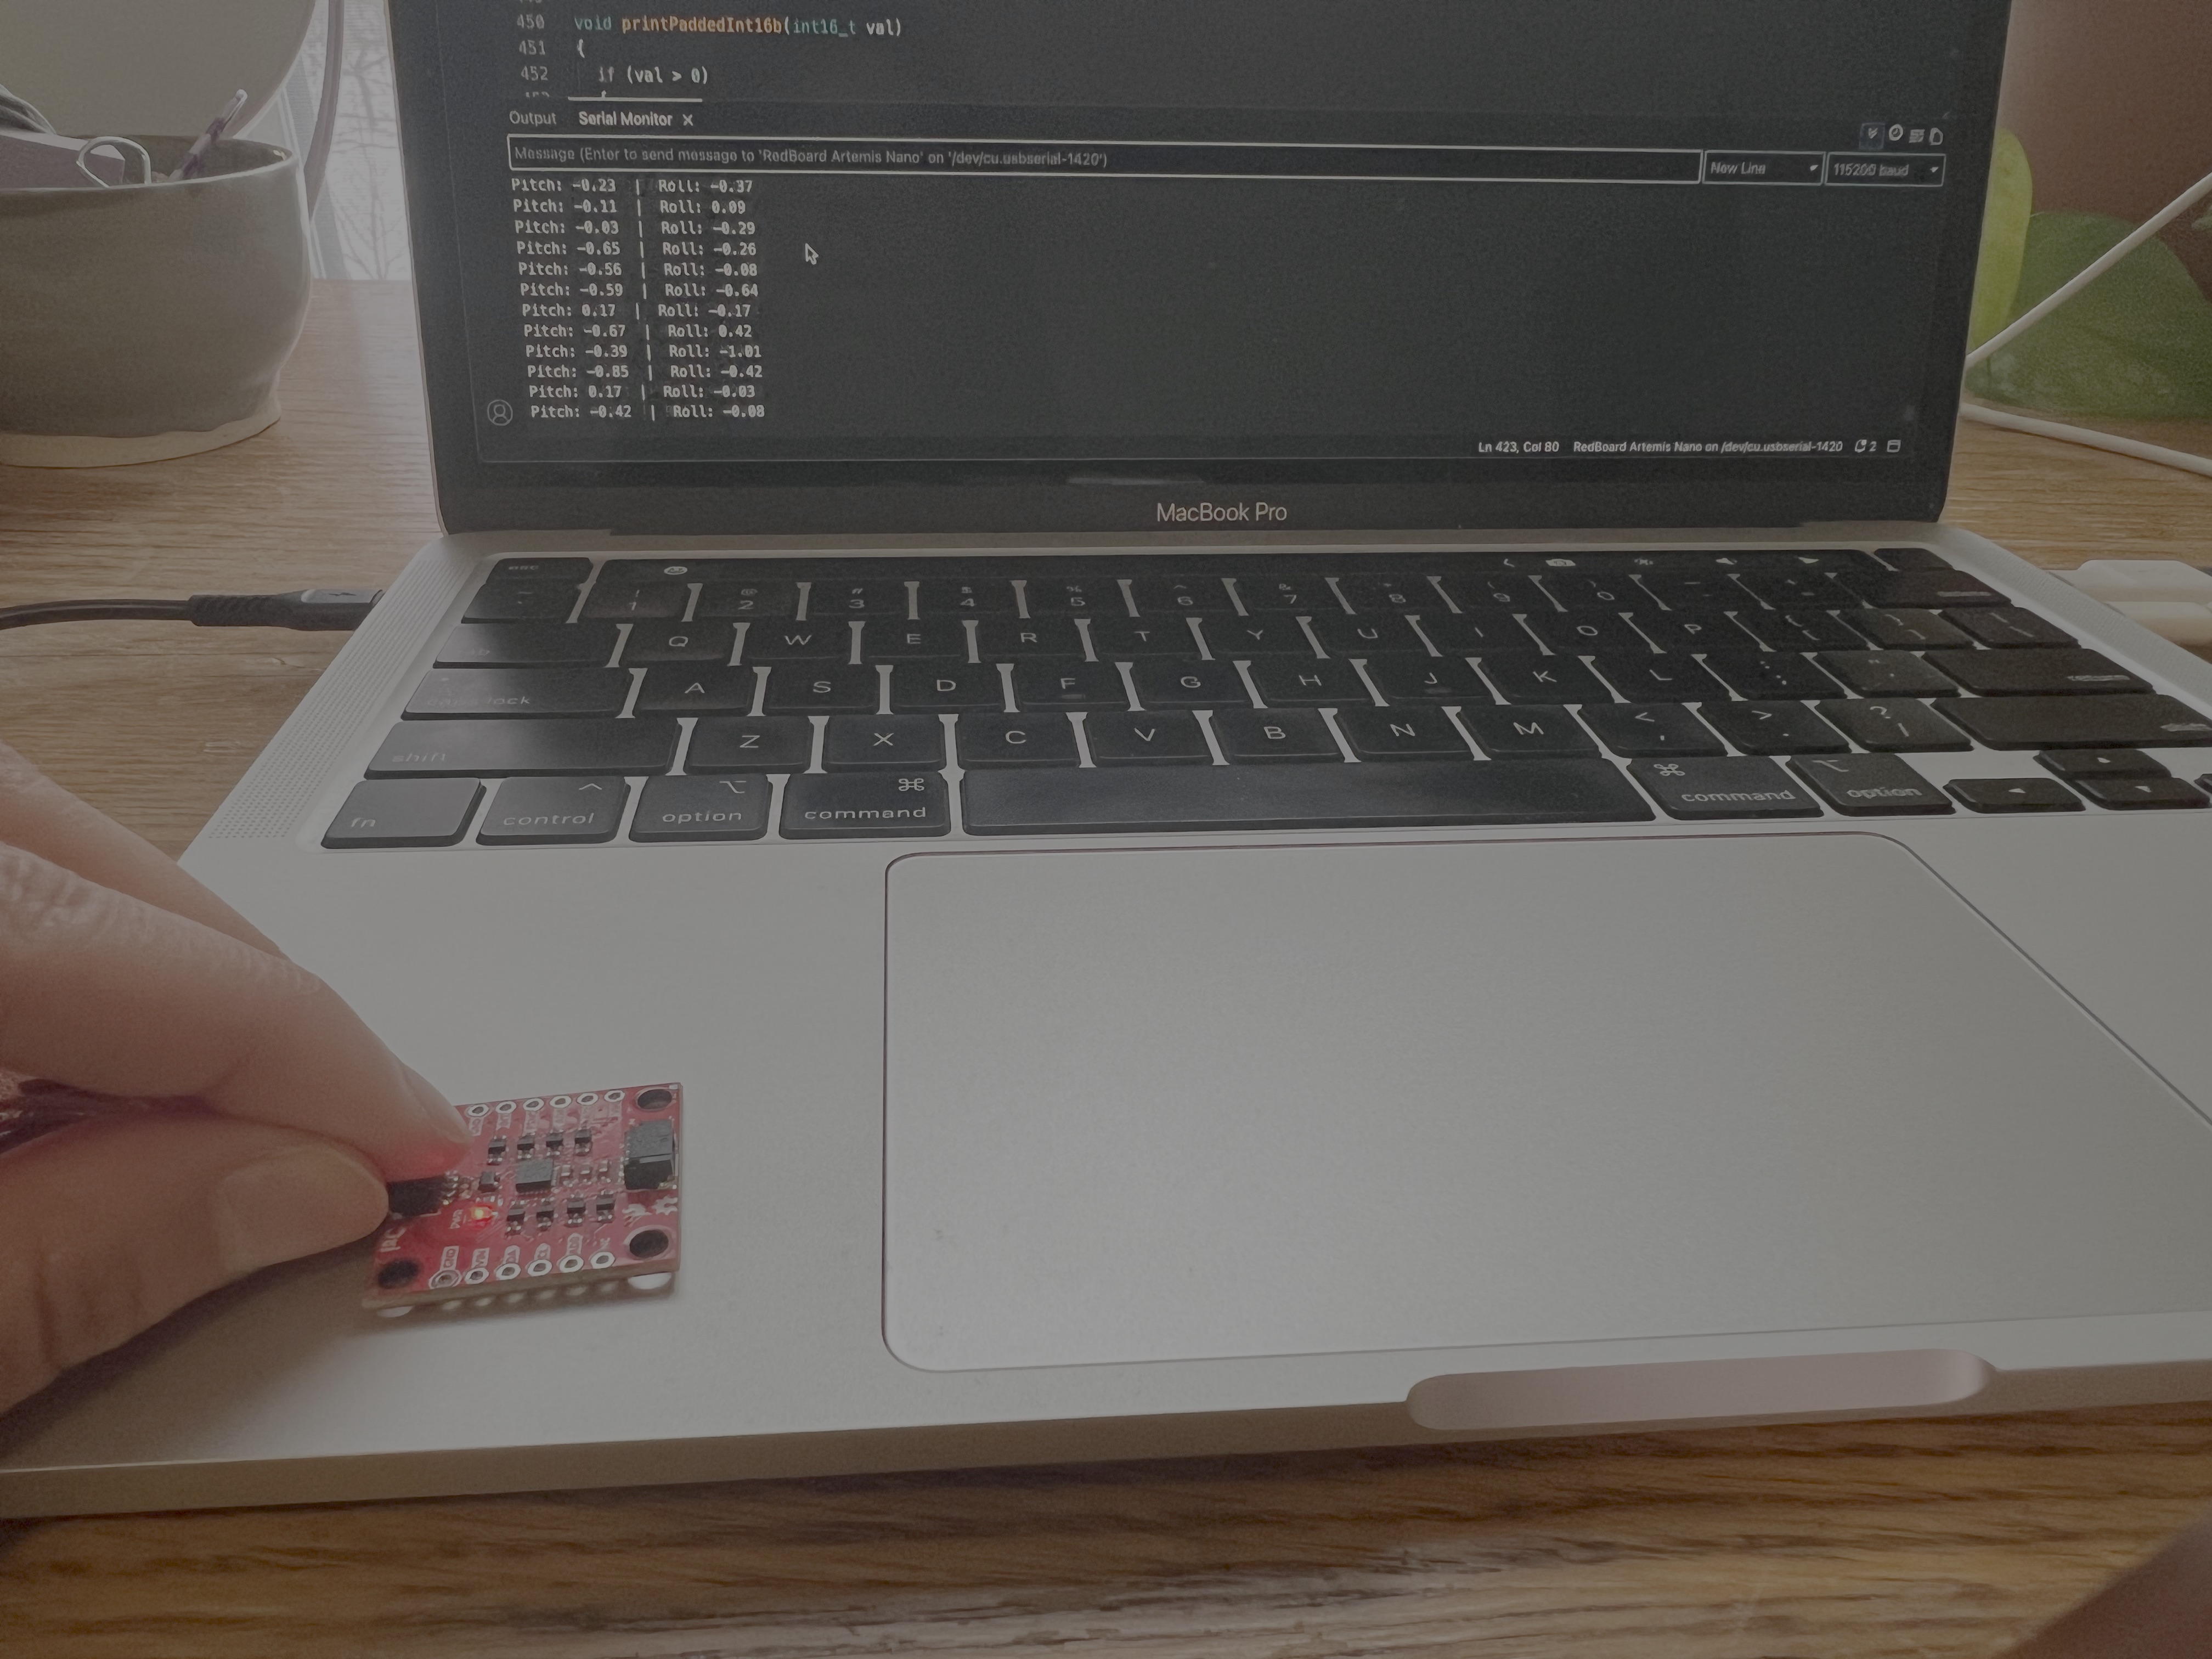
0 degree pitch and roll:
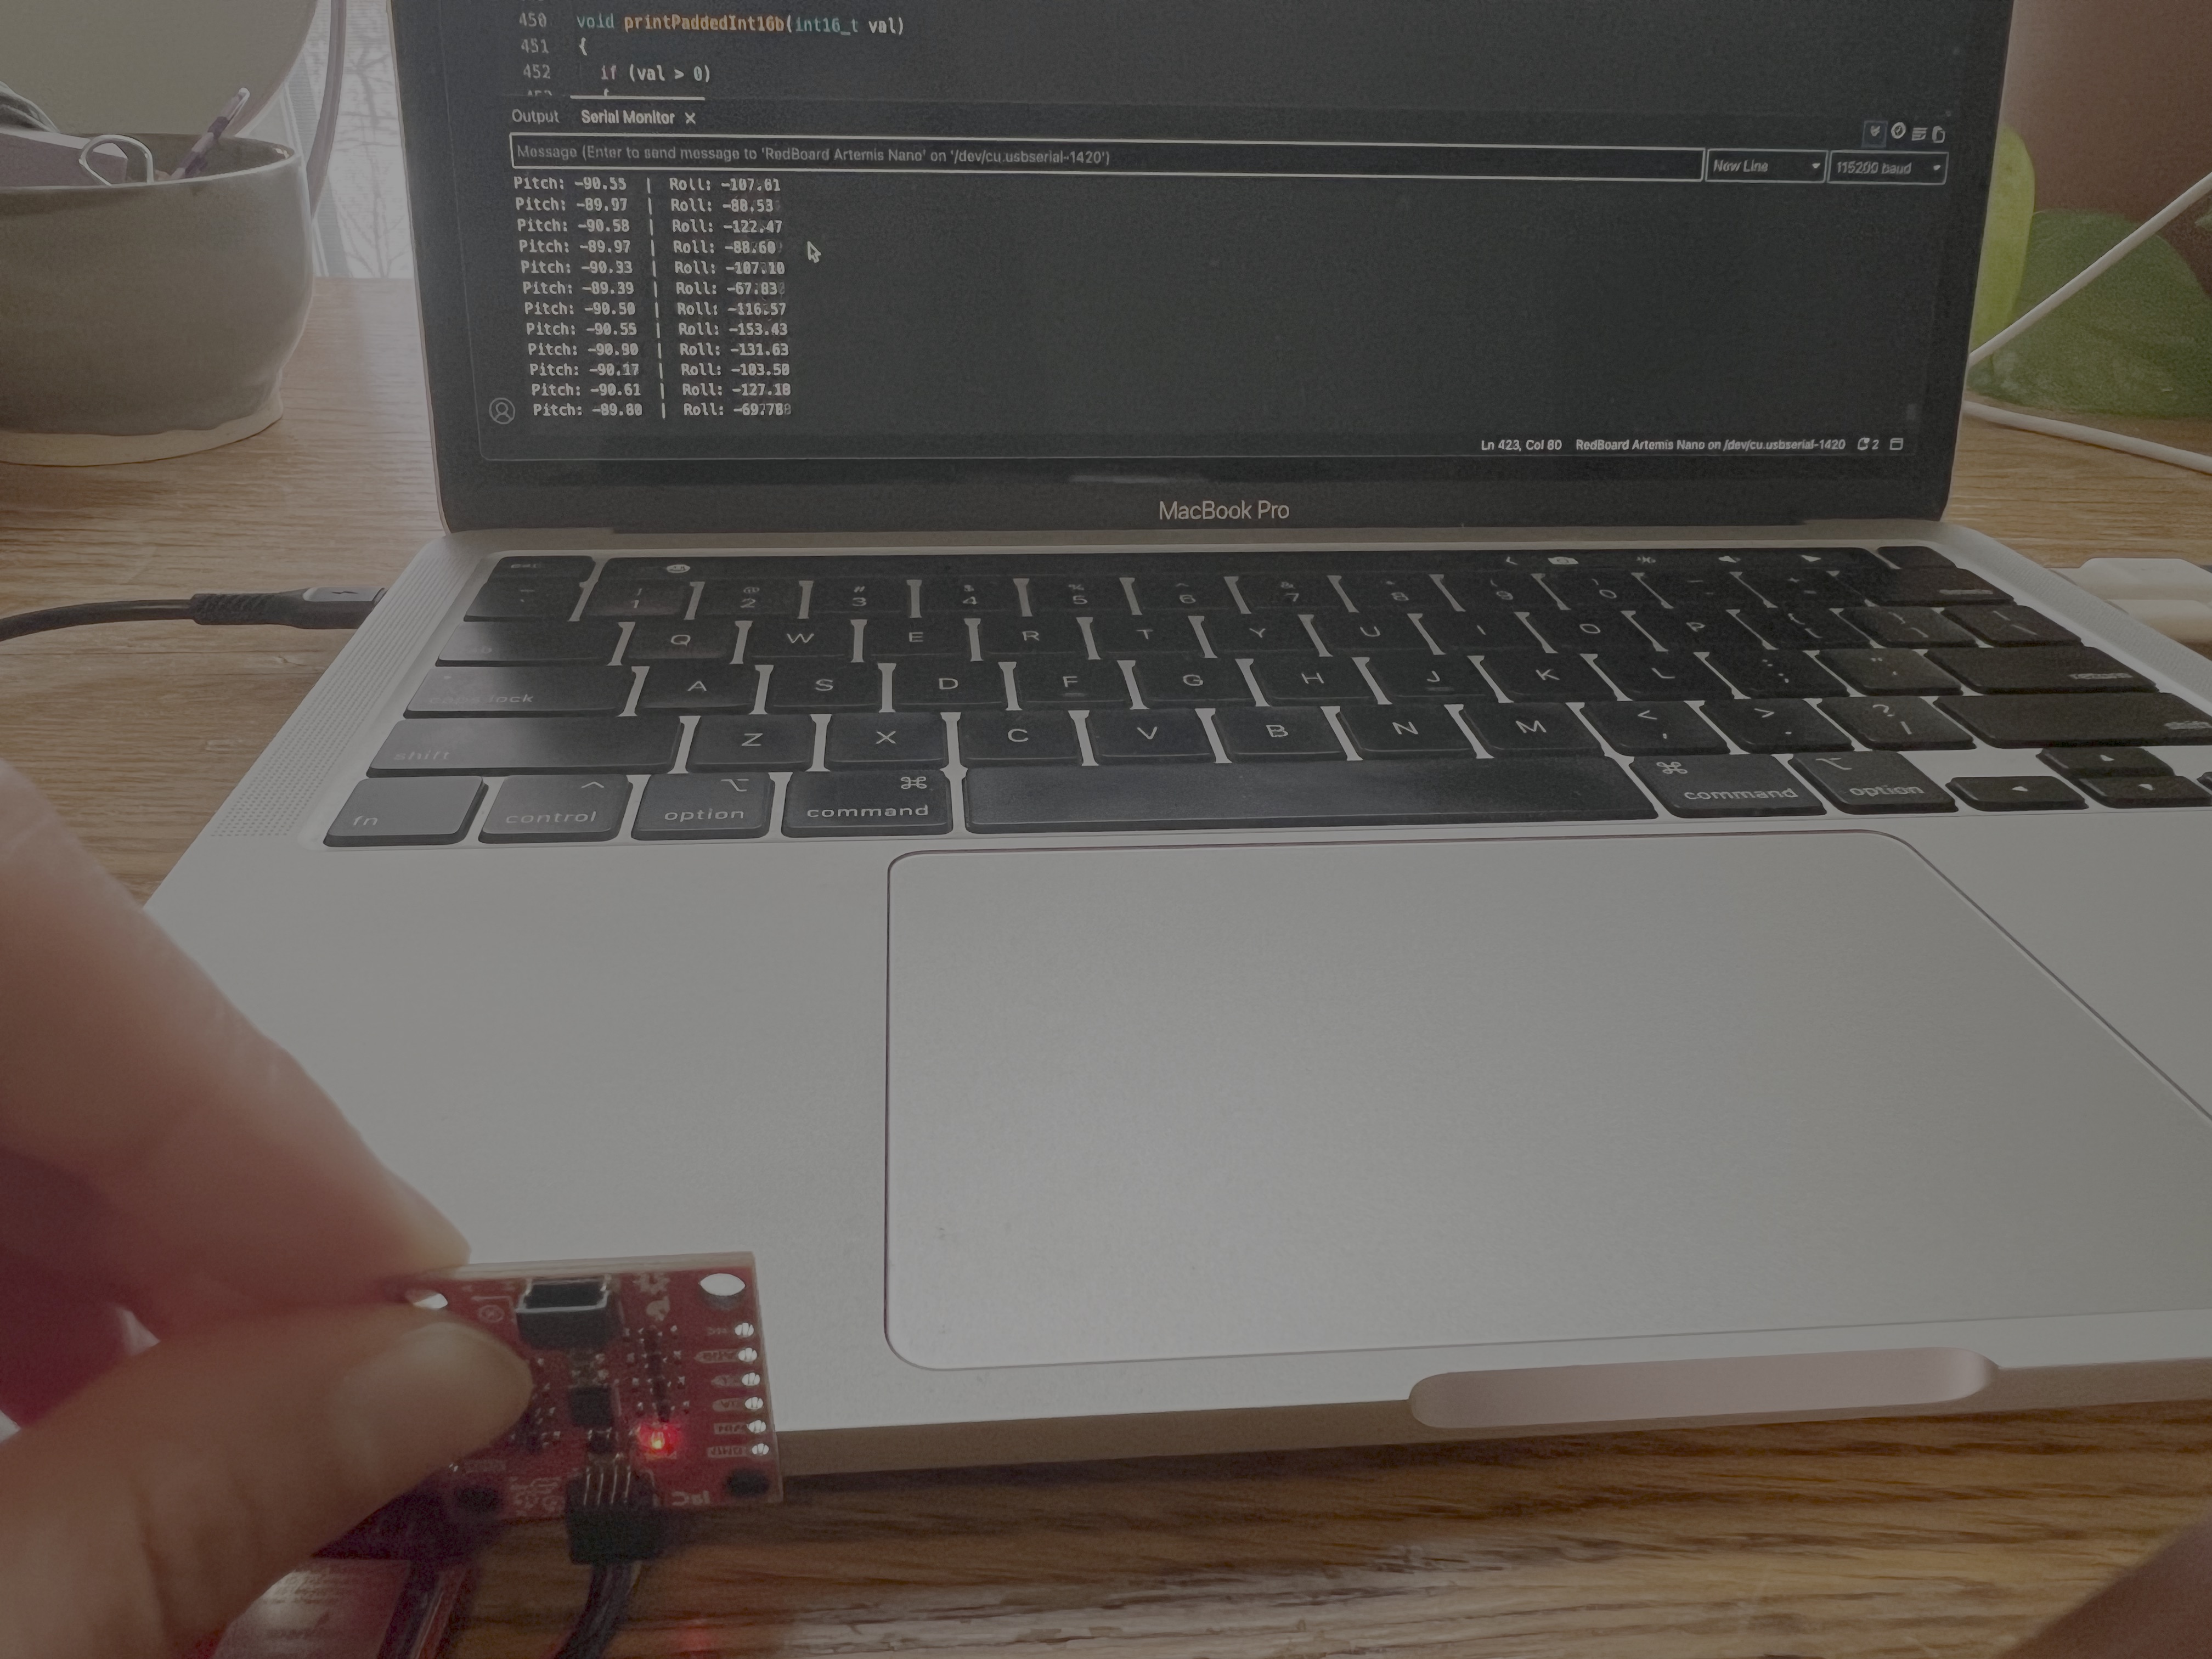
-90 degree pitch:
90 degree pitch:
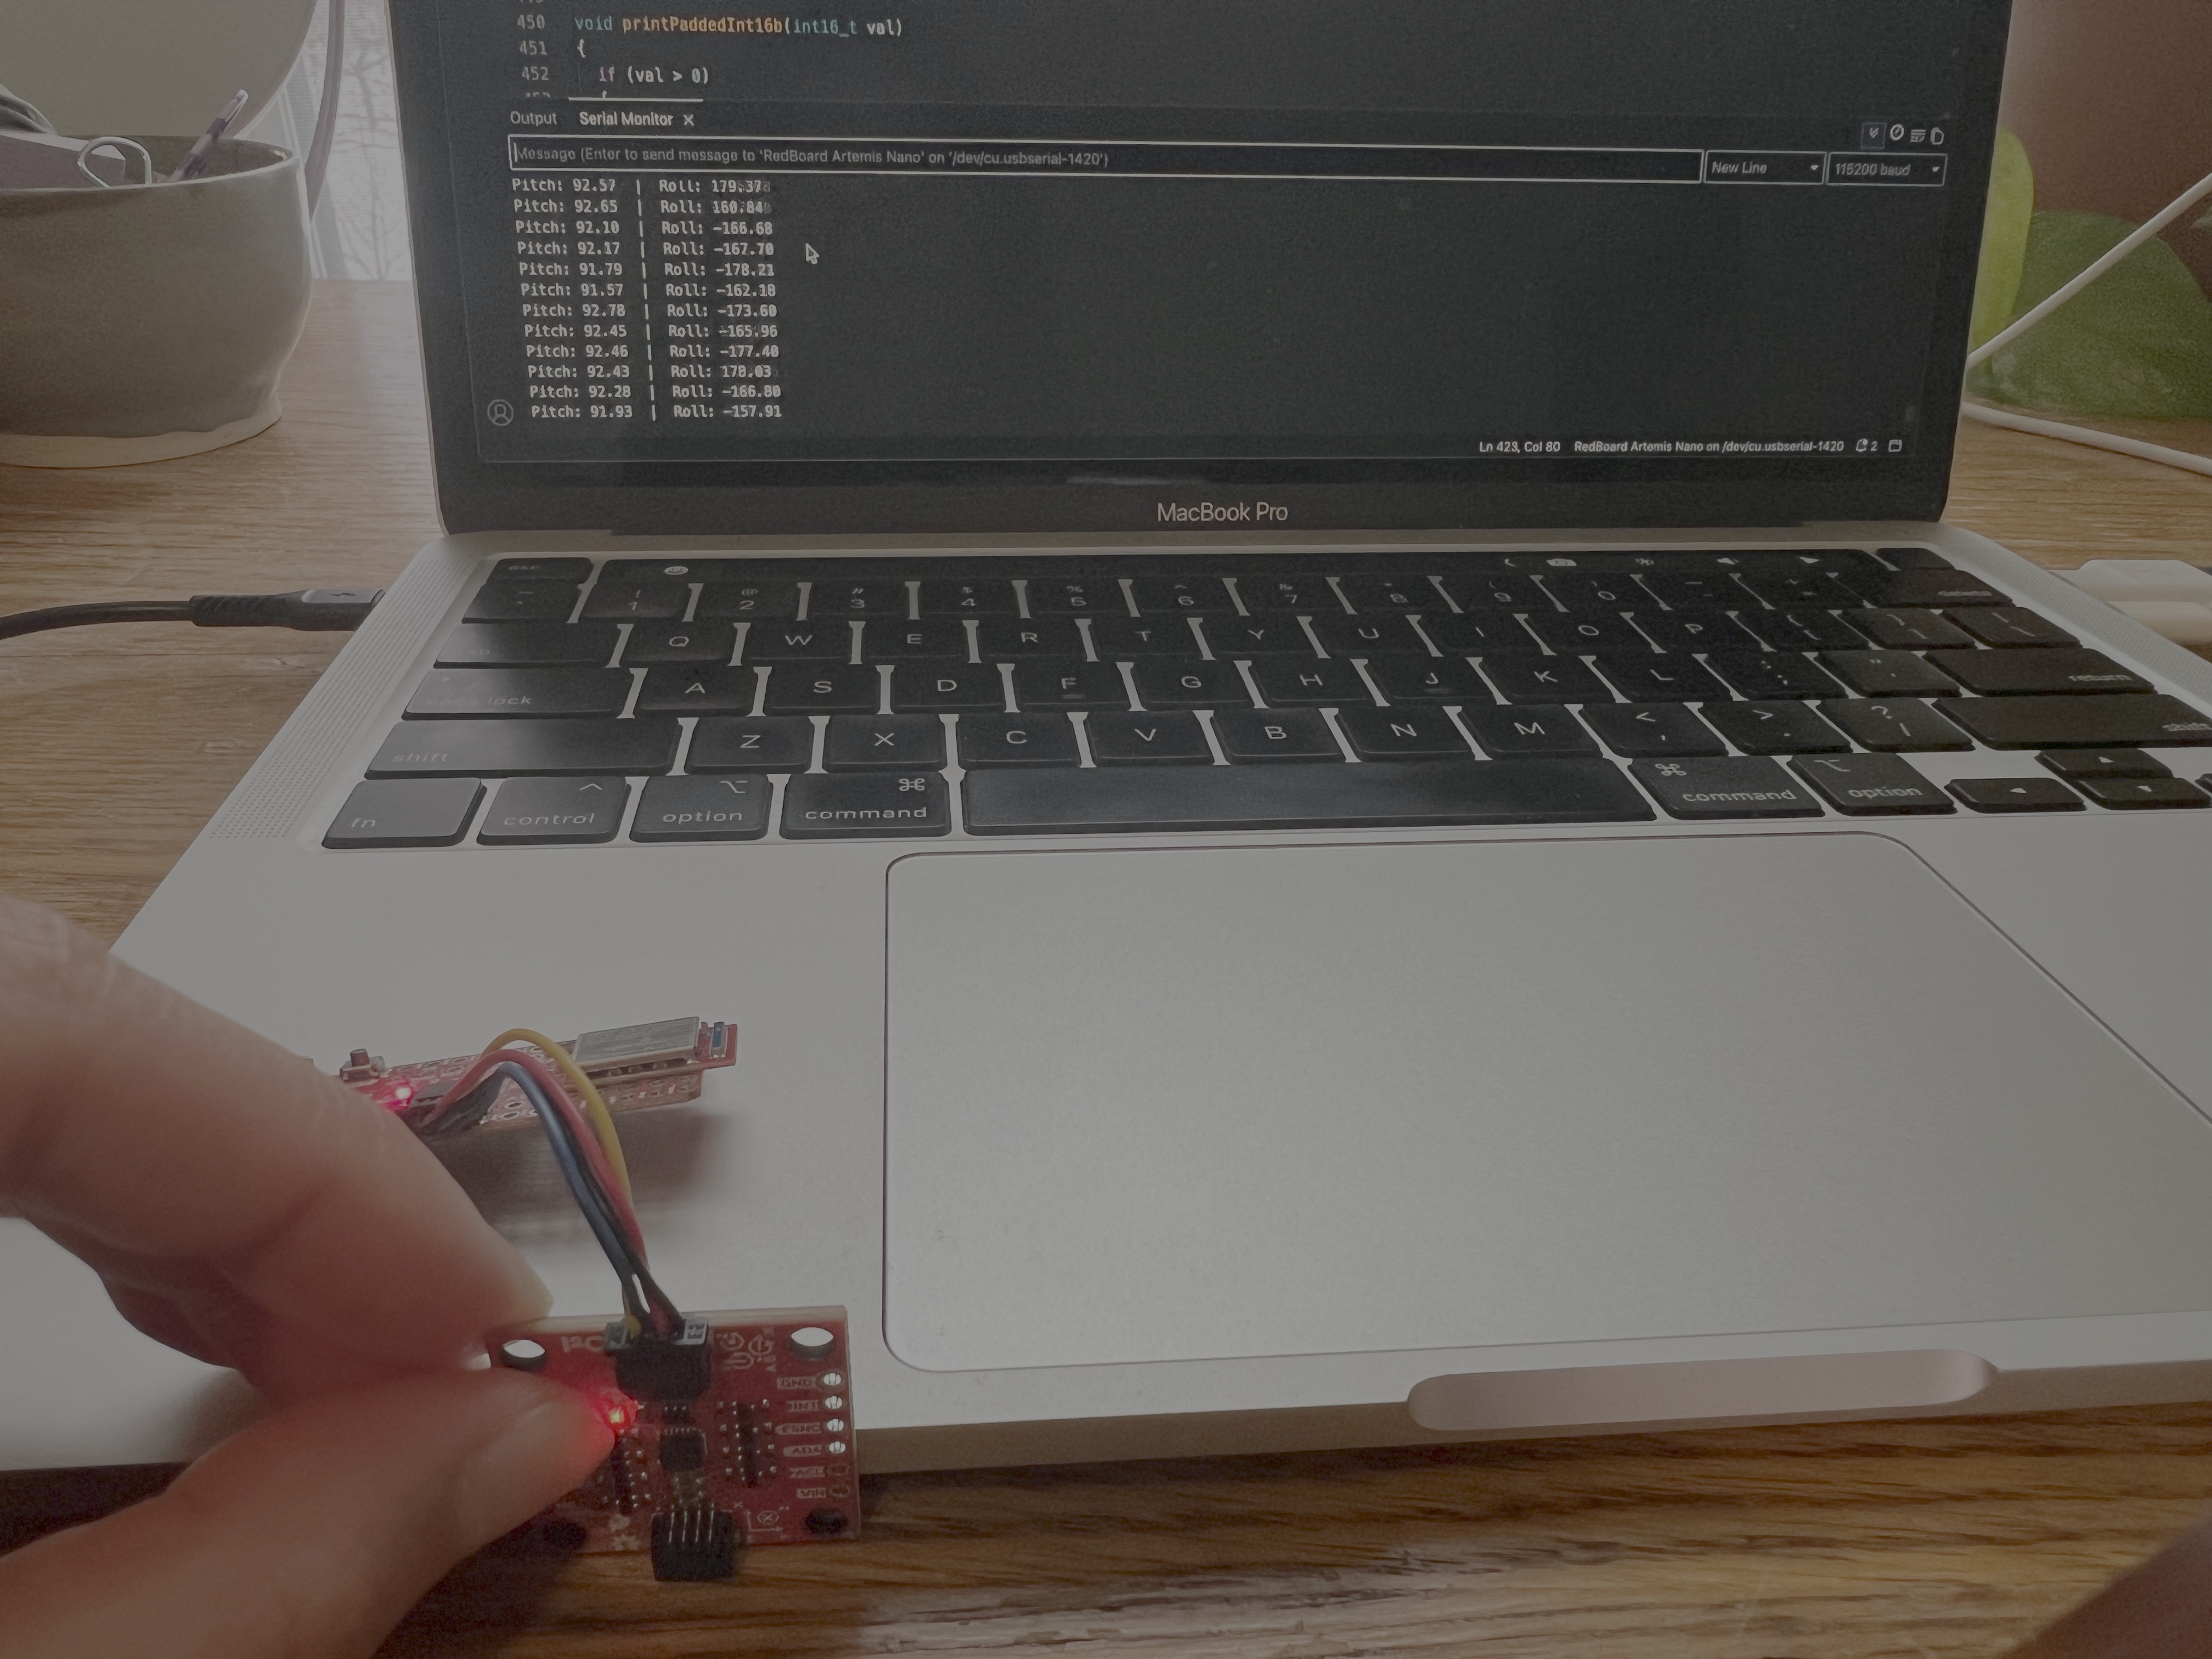
-90 degree roll:
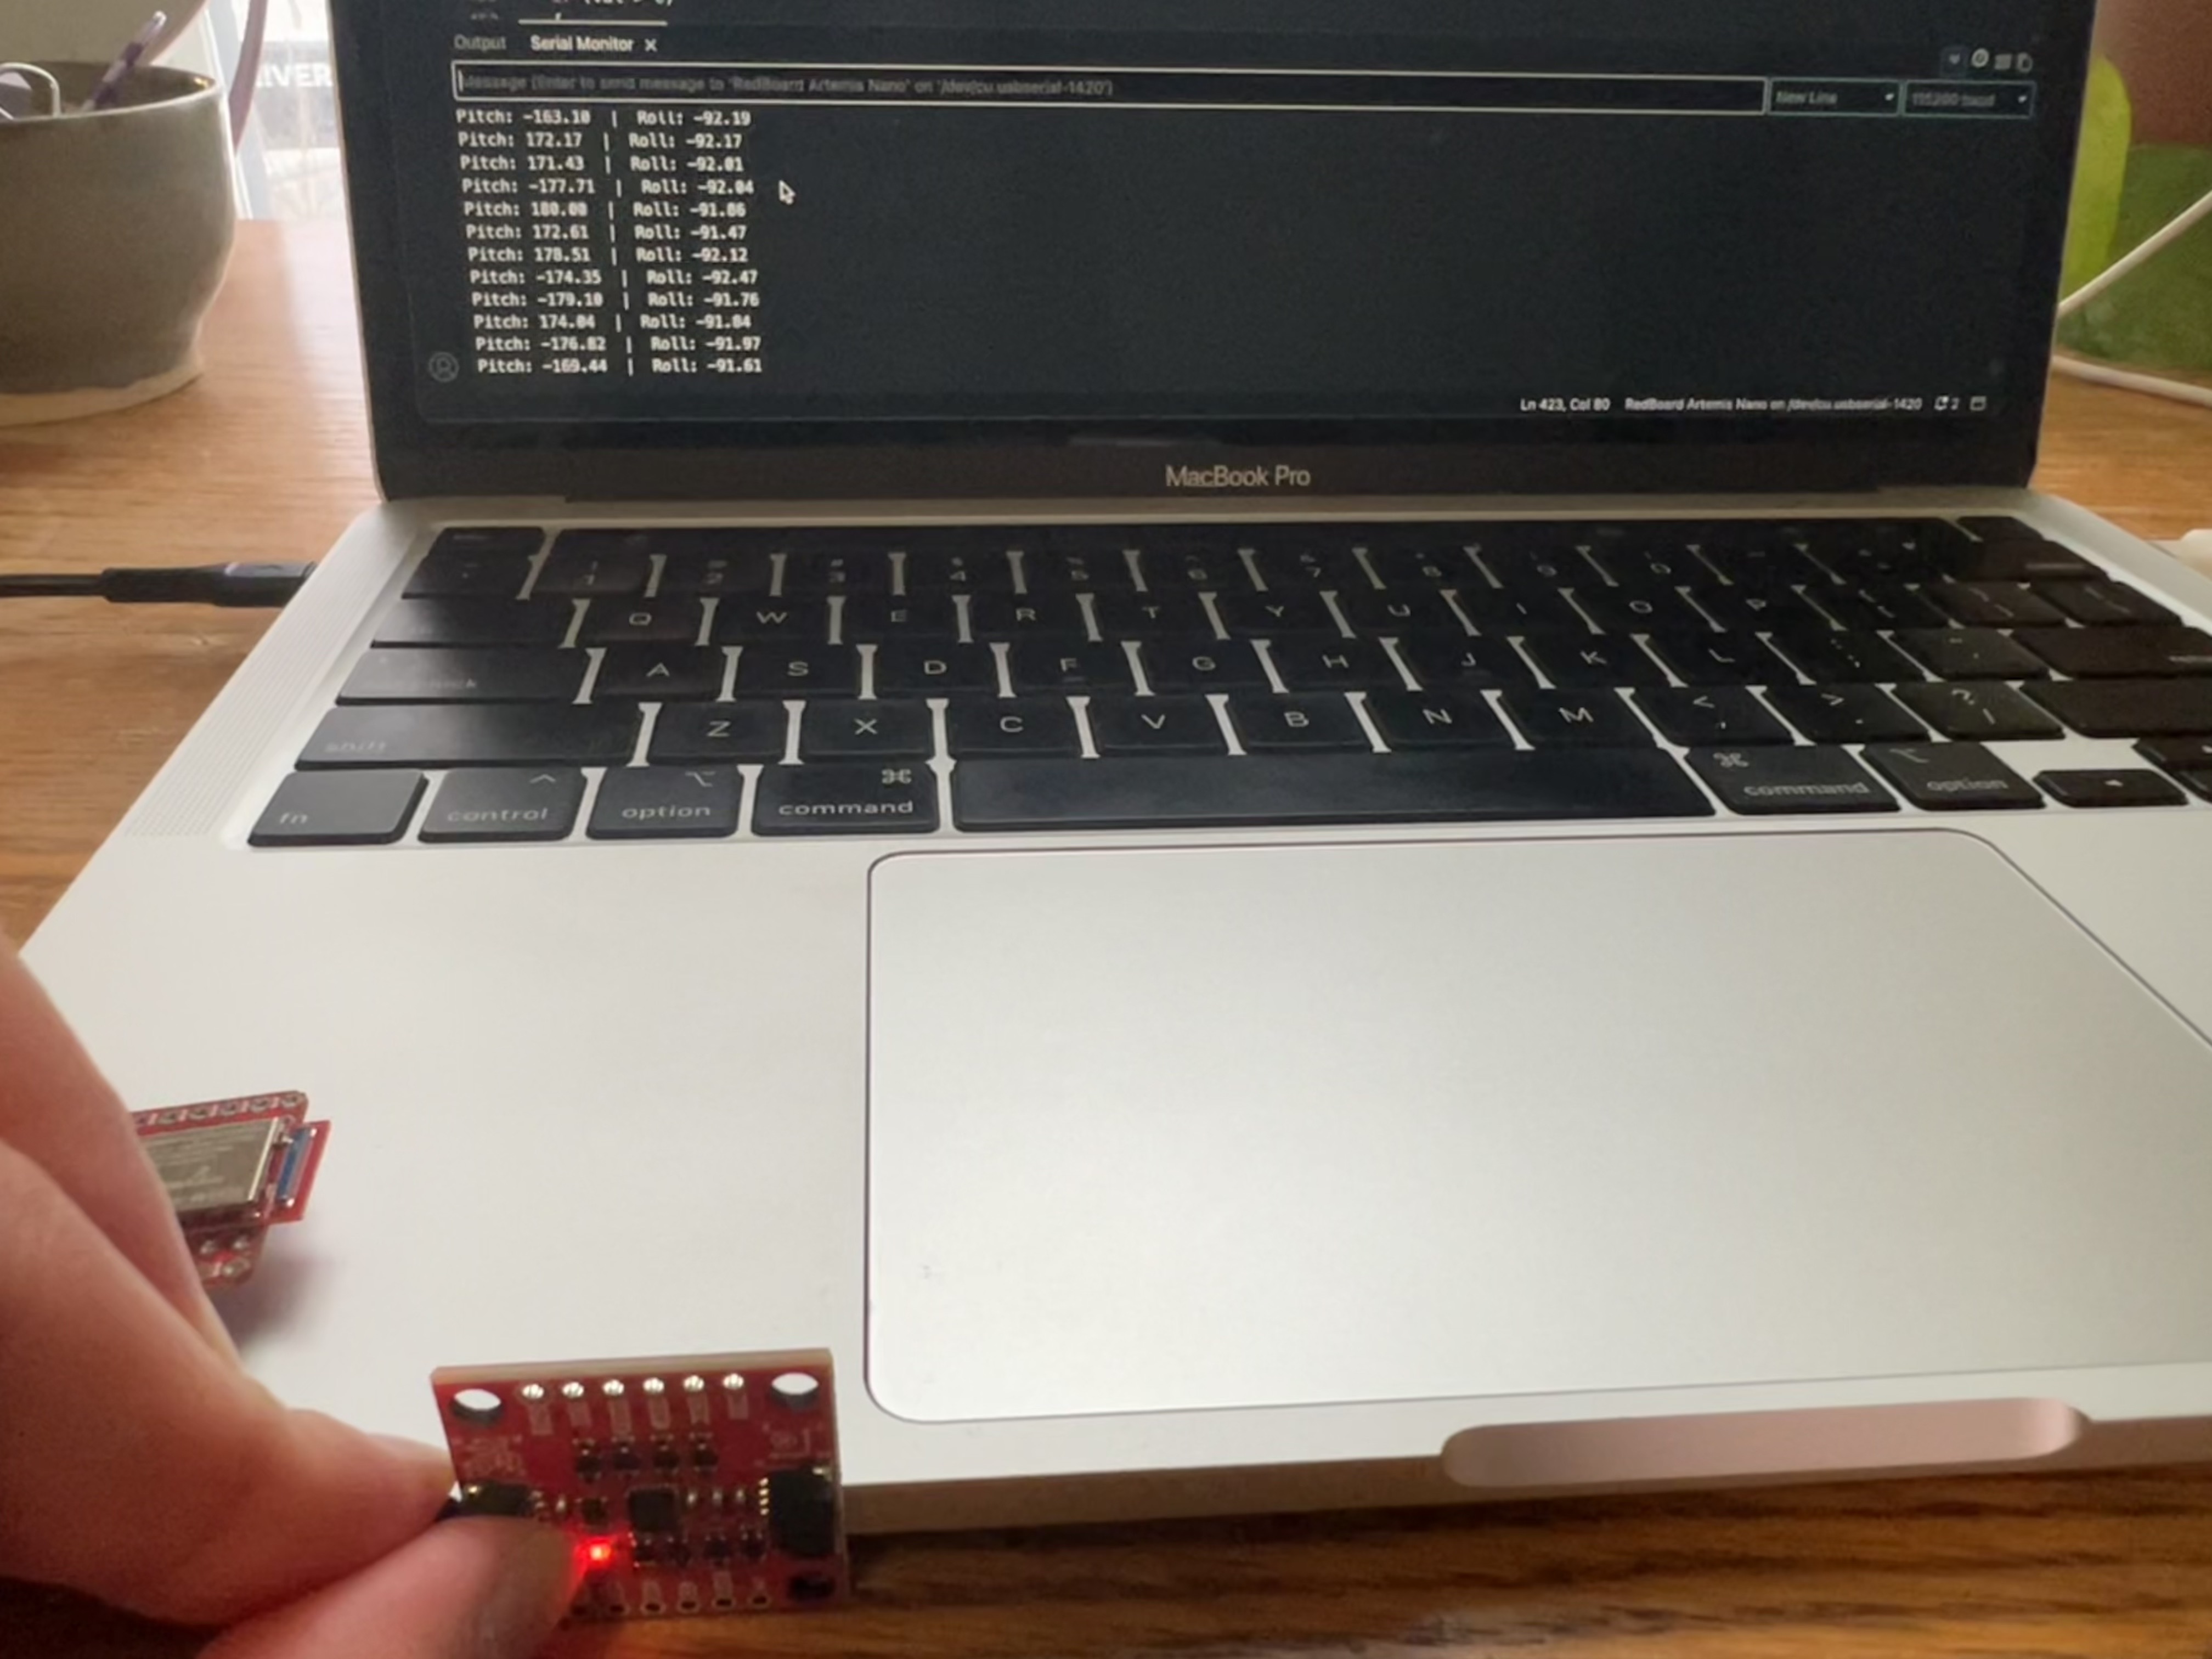
90 degree roll:
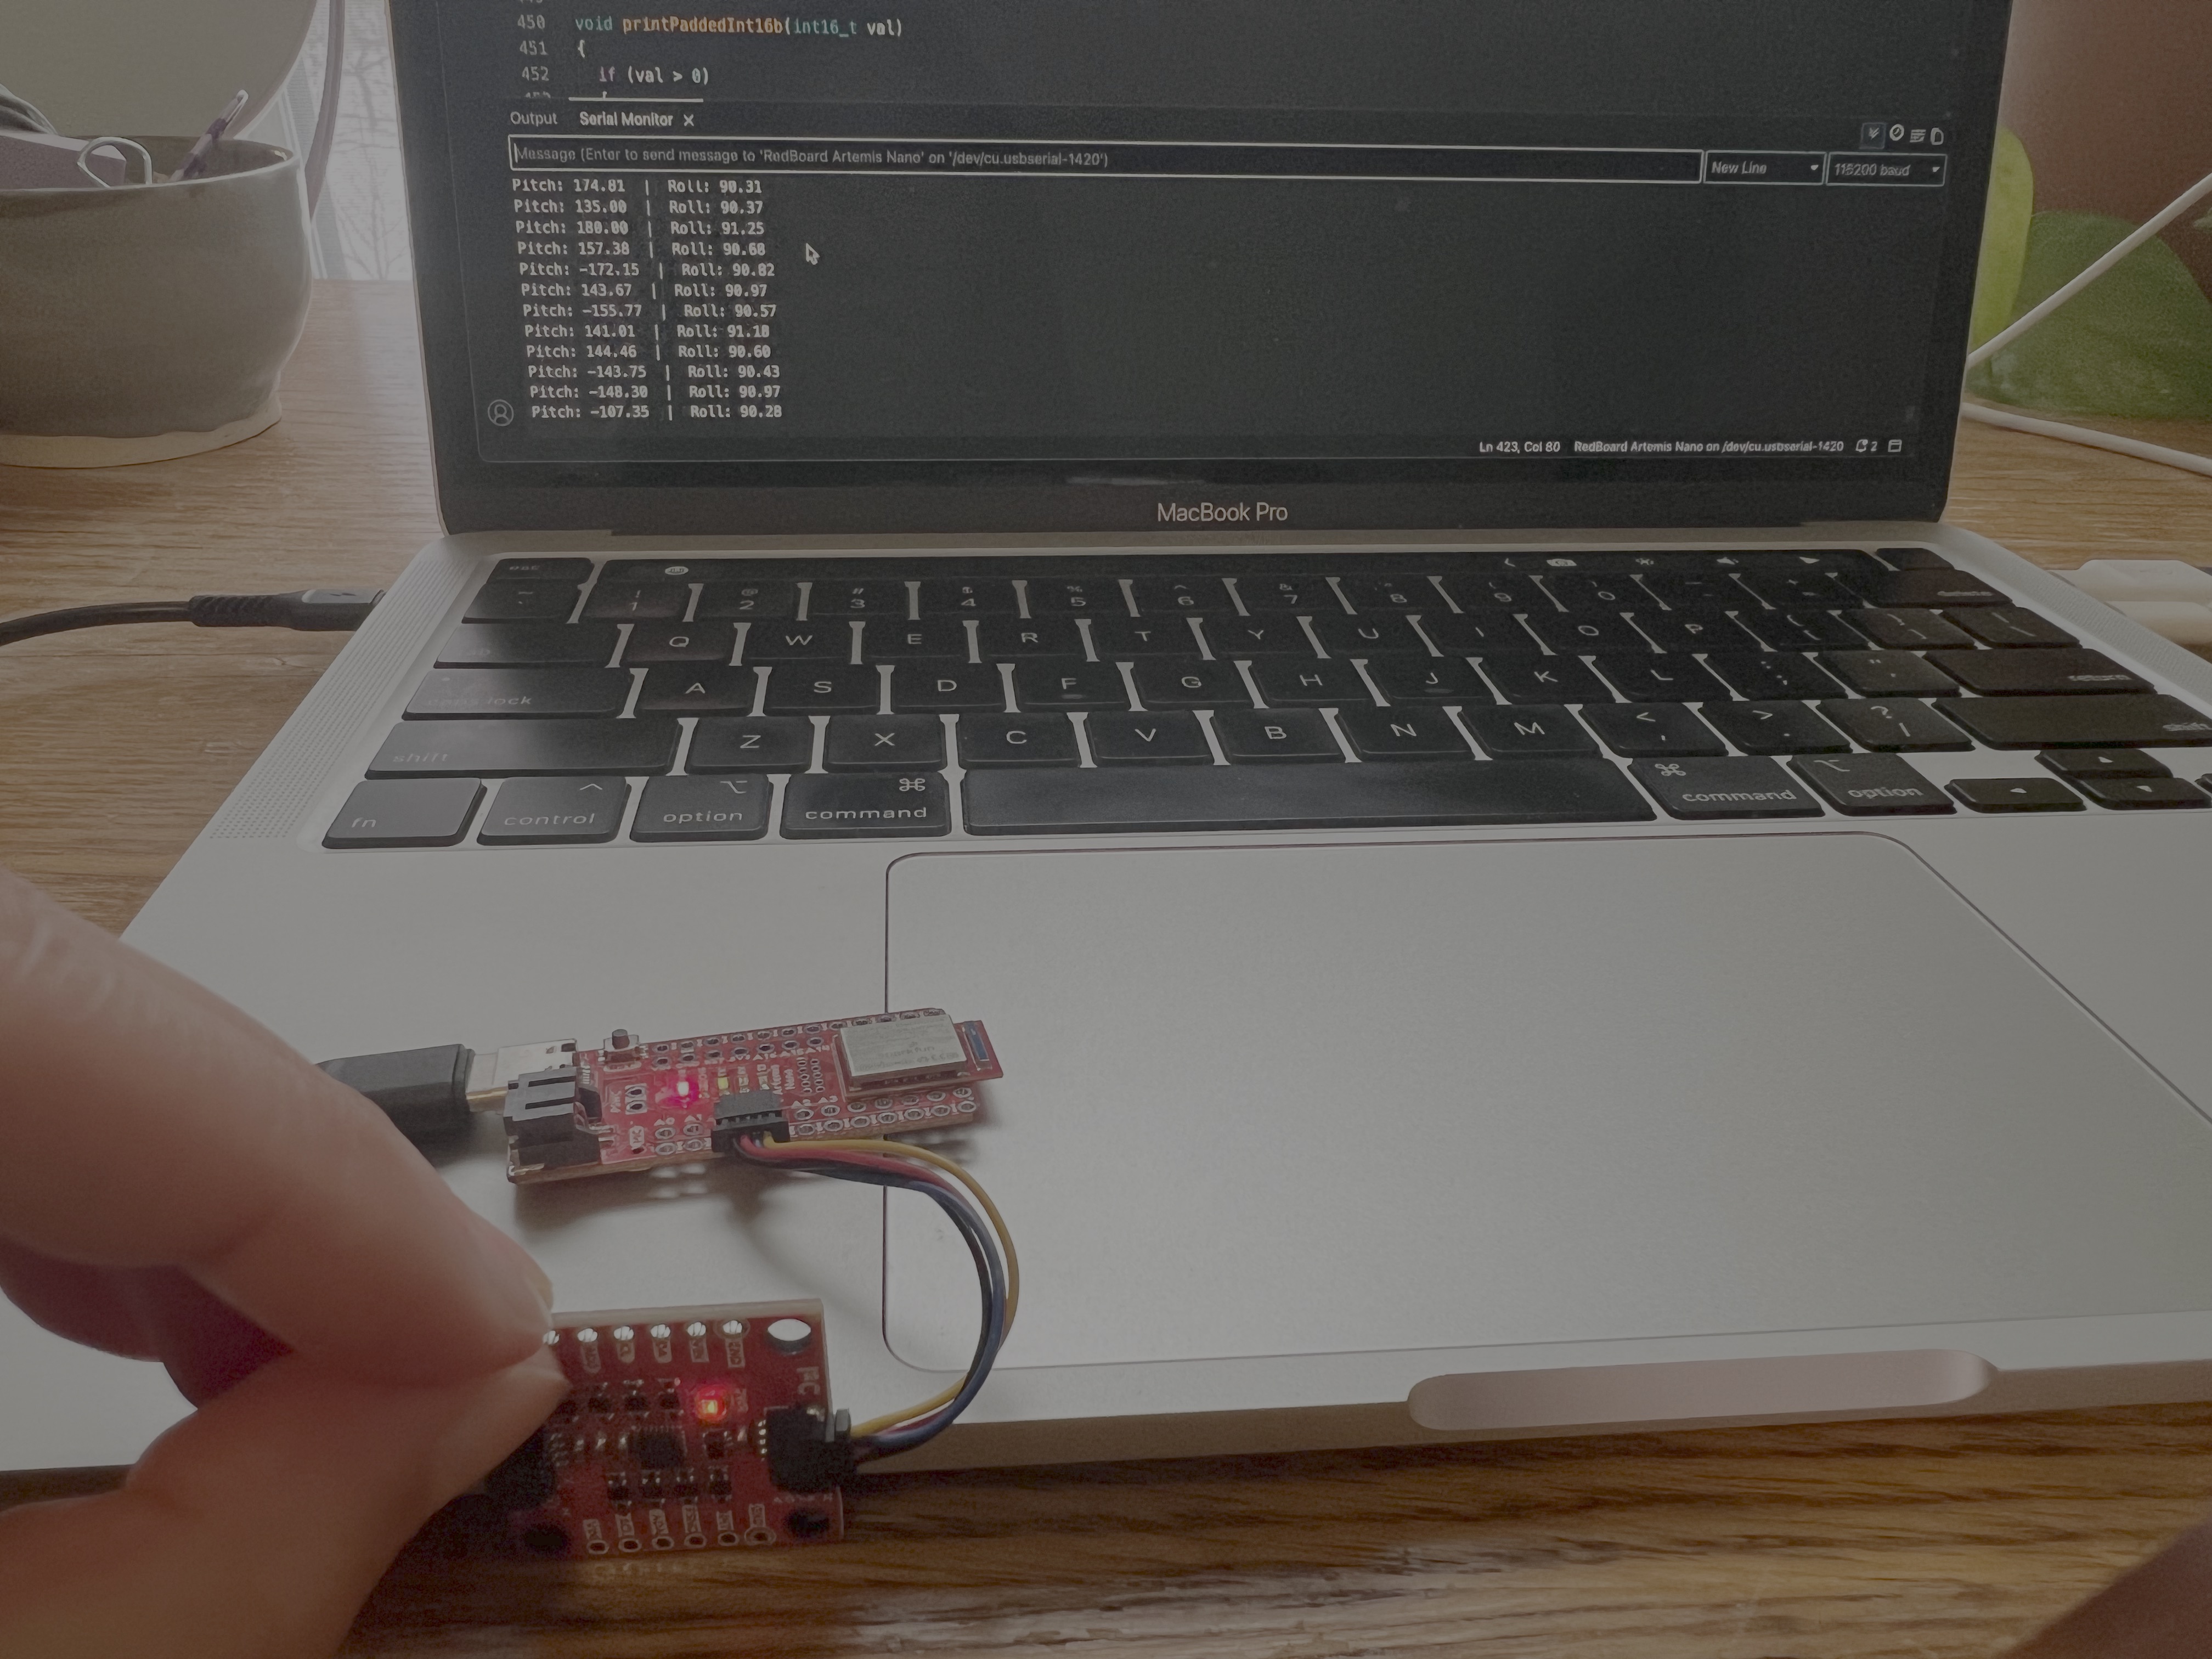
The readings were a few degrees off, but this is likely due to the fact that it wasn’t placed at exactly 0/90/-90 degrees. I believe that the acceleration data that I’m receiving is very accurate. It’s never more than 3 degrees off and part of the error can be attributed to the uneven surface that I’m using to take measurements. Based on these readings, I don’t think a two-point calibration is necessary.
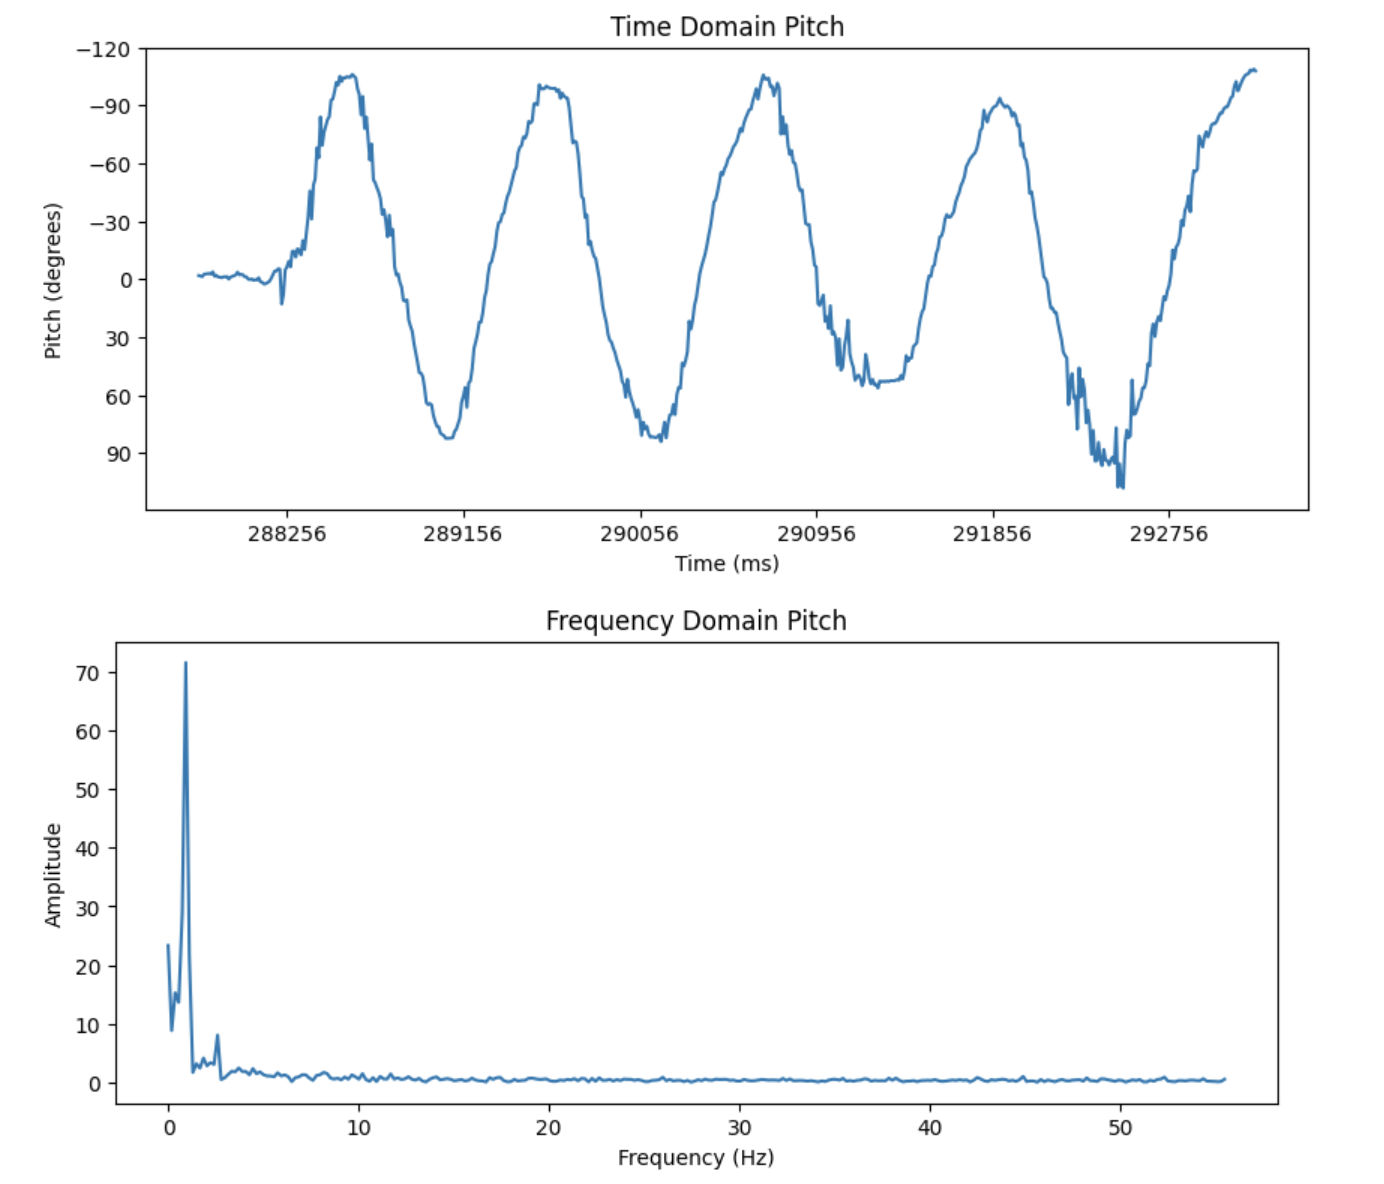
Frequency Spectrum
To get the data for frequency spectrum analysis, I tilted the IMU back and forth and stored the readings in arrays along with the time. I used a notification handler in Jupyter and wrote a command called SEND_ACC_DATA in Arduino in order to send pitch and roll data over bluetooth.
Snippet from SEND_ACC_DATA:
for (int i=0; i<acc_size; i++){
  tx_estring_value.clear();
  tx_estring_value.append(a_time_array[i]);
  tx_estring_value.append(",");
  tx_estring_value.append(a_pitch_array[i]);
  tx_estring_value.append(",");
  tx_estring_value.append(a_roll_array[i]);
  tx_characteristic_string.writeValue(tx_estring_value.c_str());
}
Notification Handler:
def notification_handler(uuid, byte_array):
    s = ble.bytearray_to_string(byte_array)

    time, pitch, roll = s.split(",")
    print("Time: " + time, end = " ")
    print("Pitch: " + pitch, end = " ")
    print("Roll: " + roll)

    a_time.append(time)
    a_pitch.append(float(pitch))
    a_roll.append(float(roll))
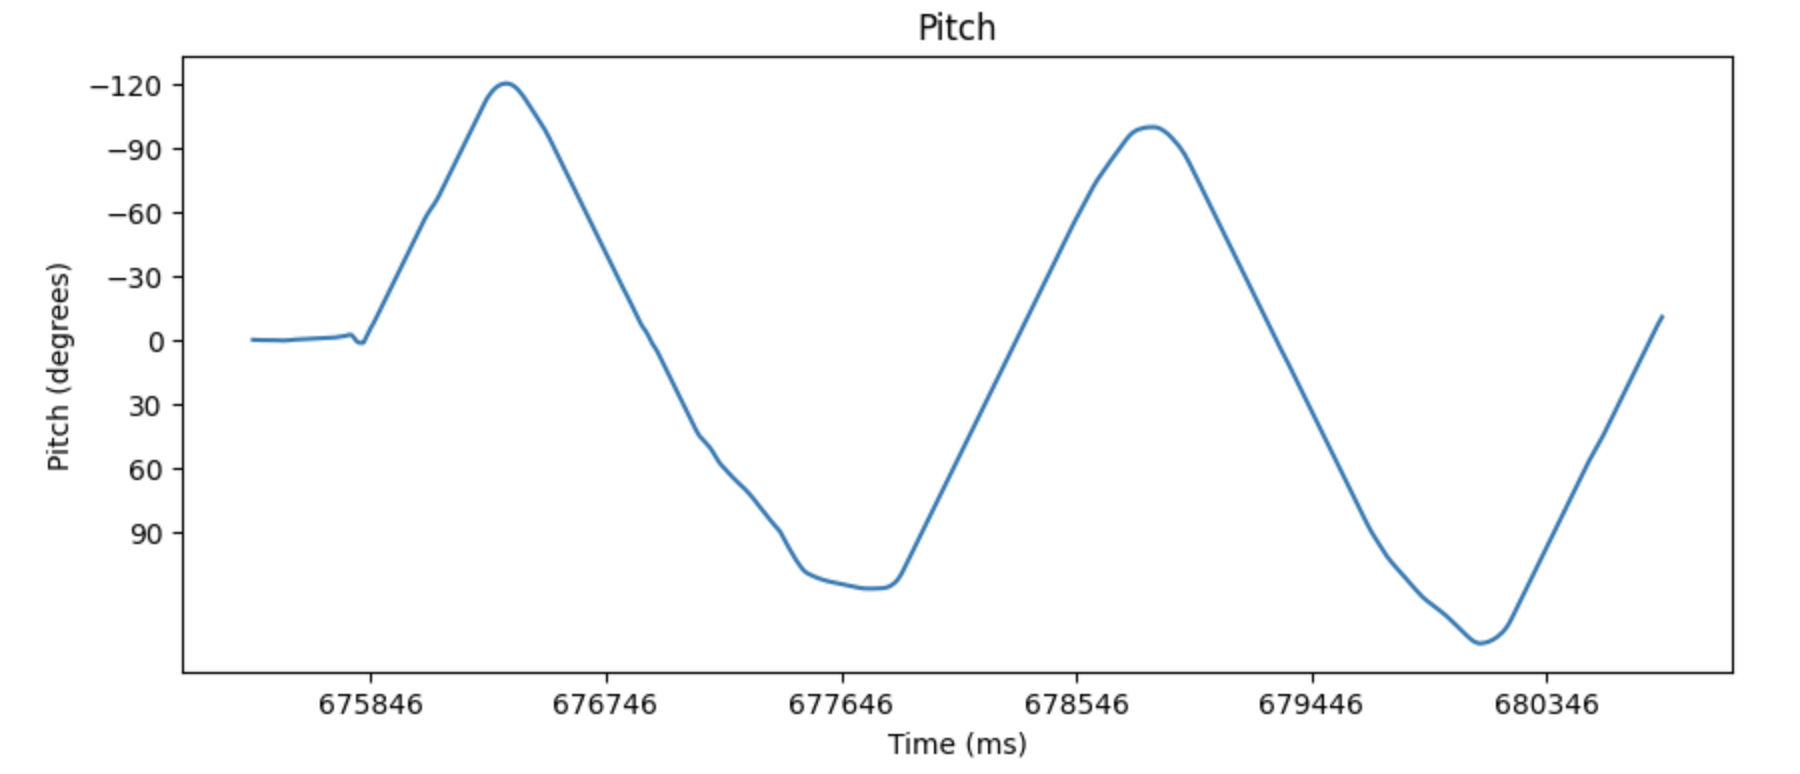
Data for Pitch:
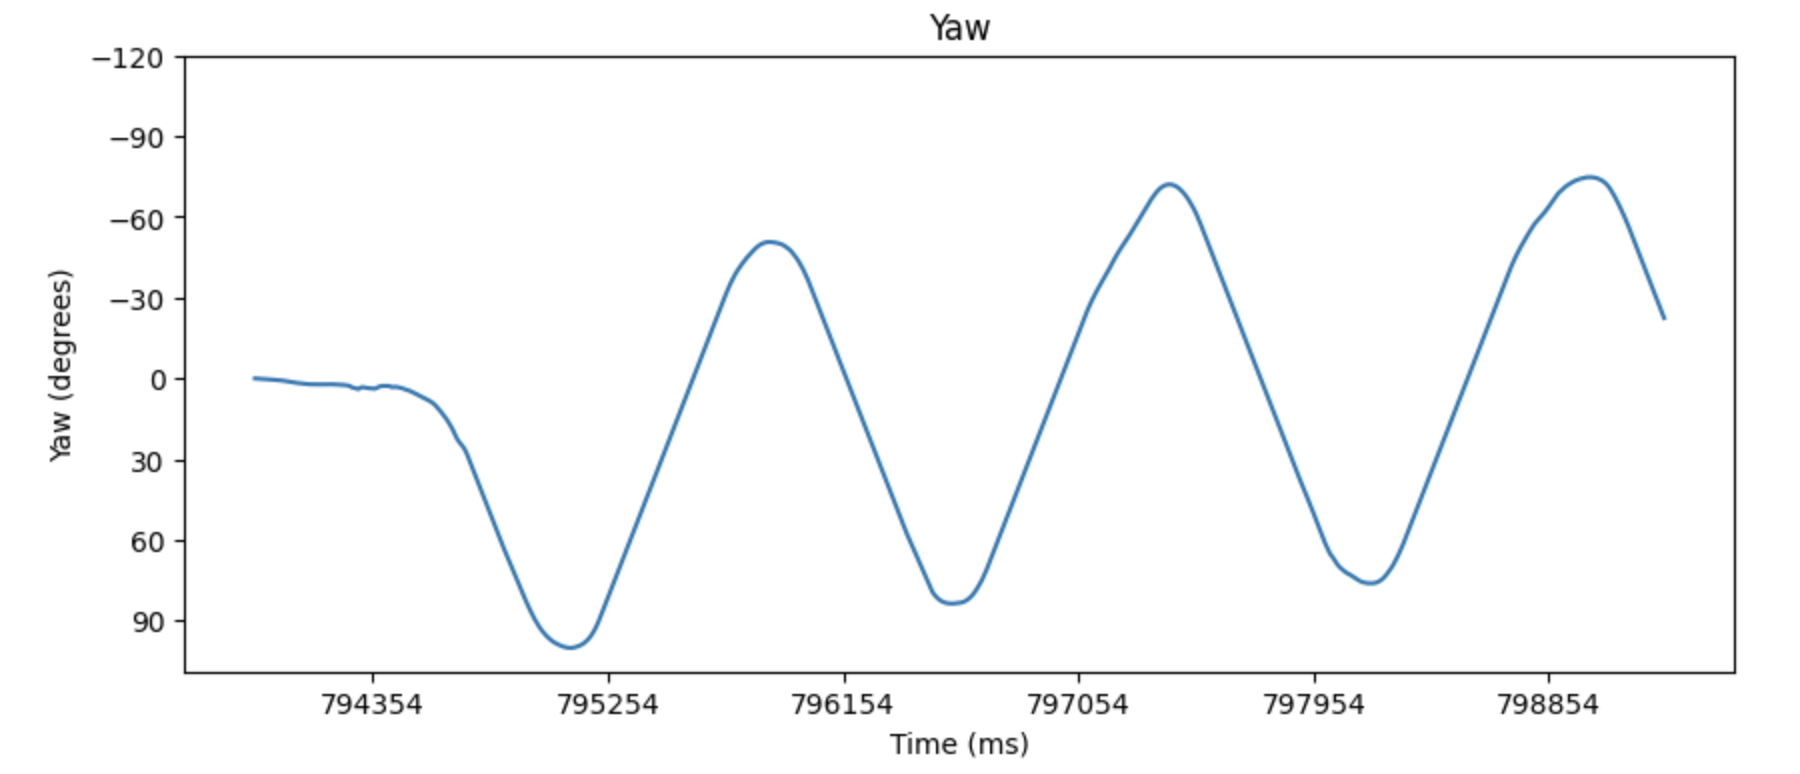
Data for Roll:
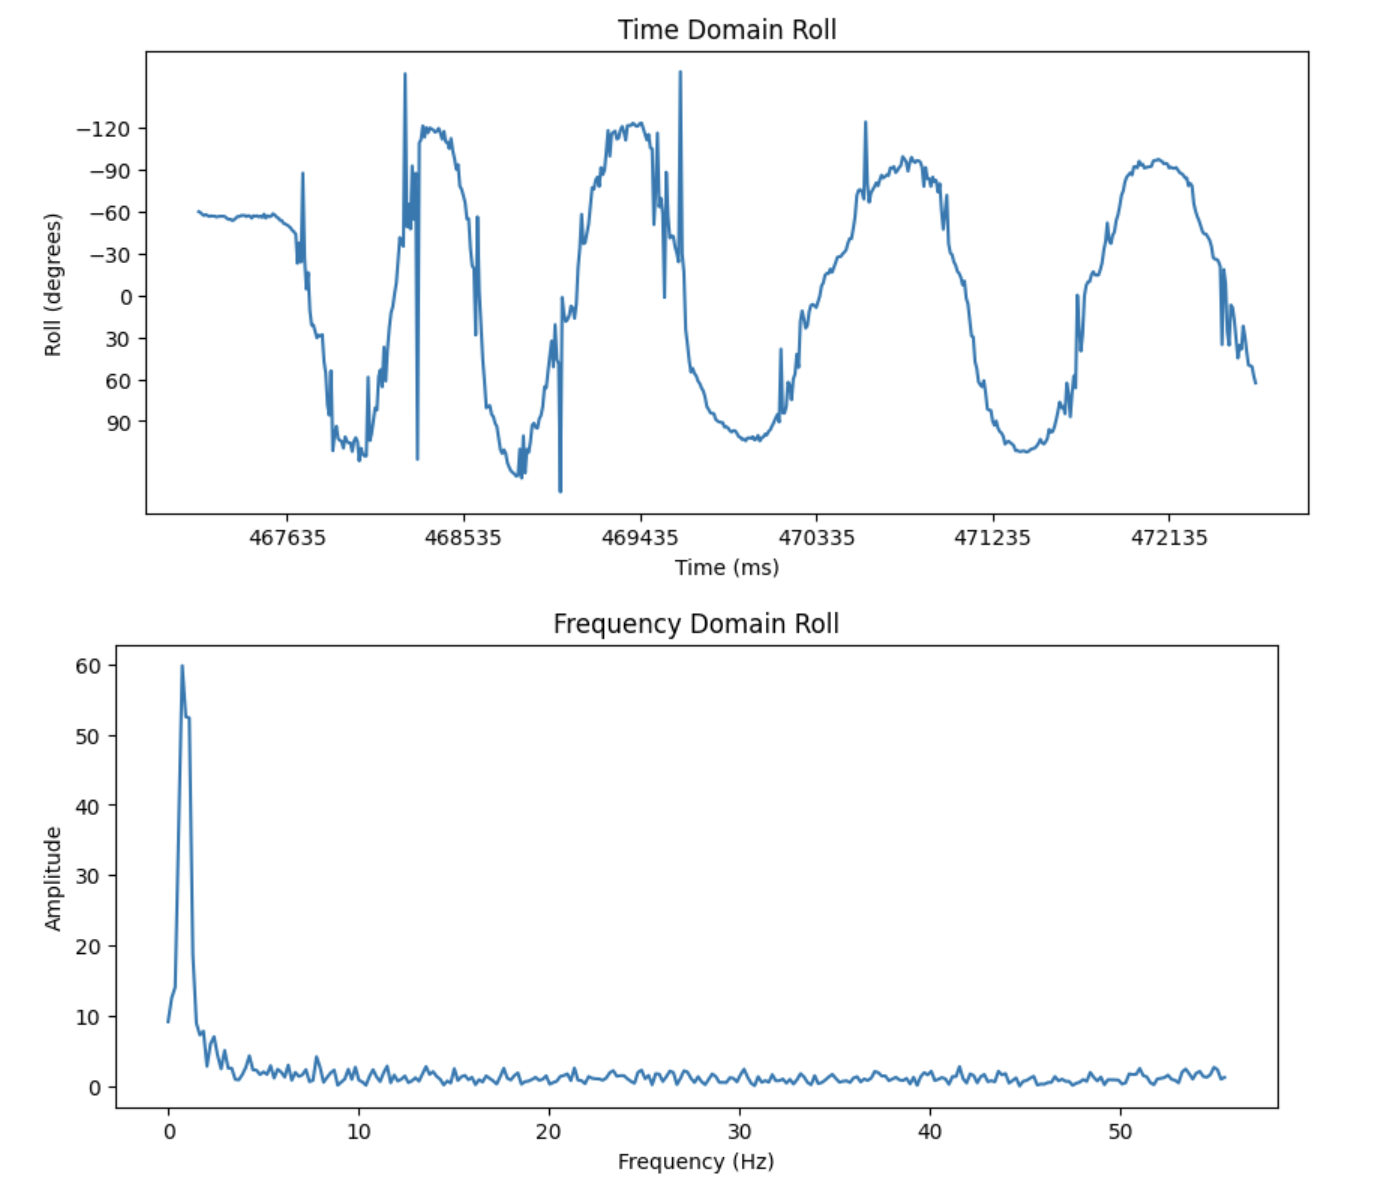
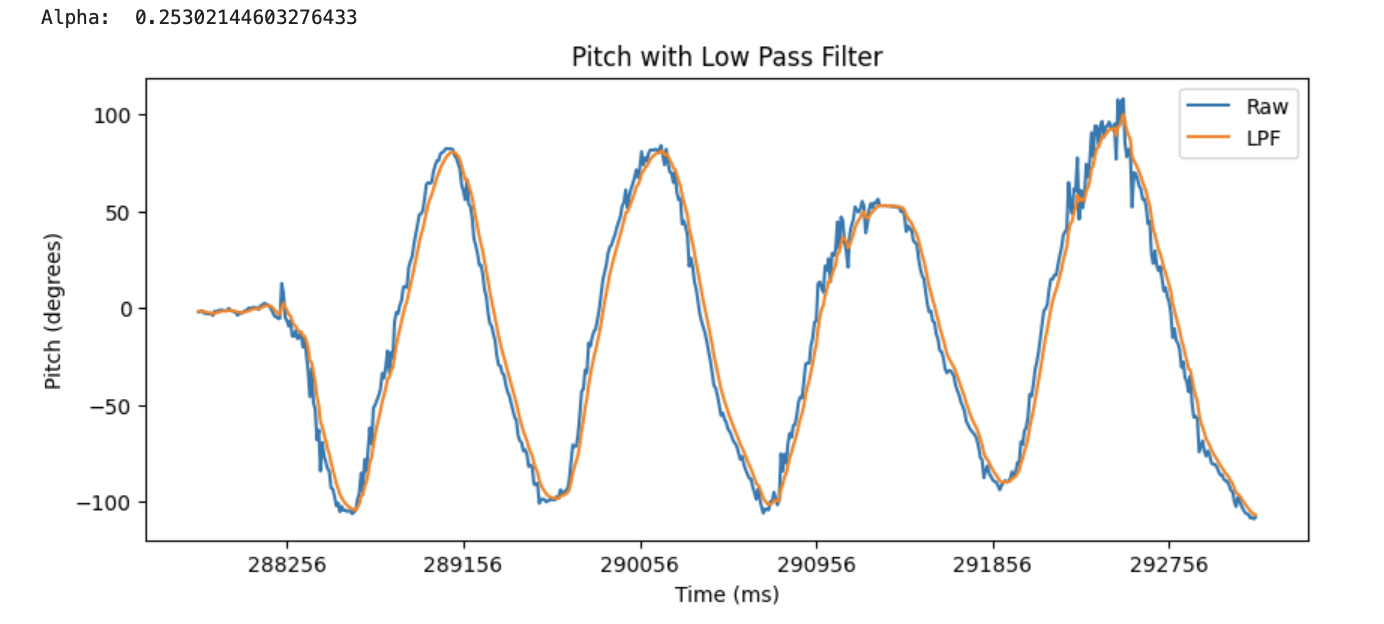
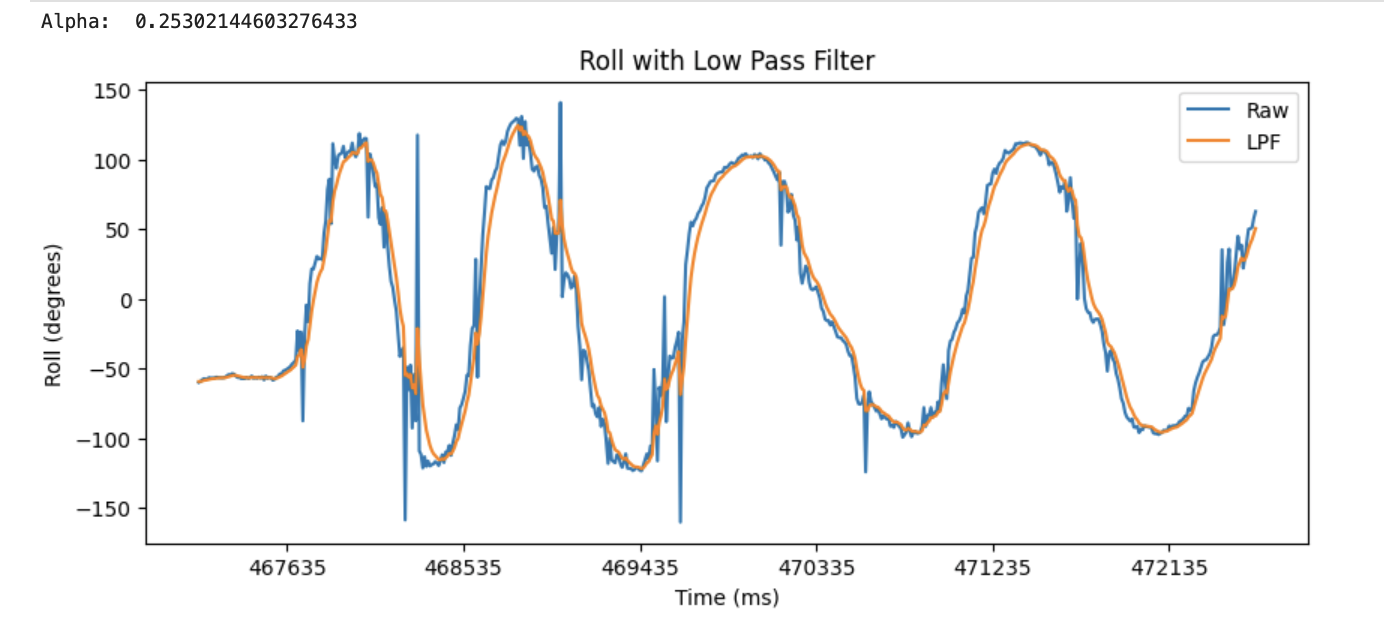
From these graphs, I believe that there is some noise that can be reduced with a low pass filter. This is because the spikes in the frequency graphs appear to be contained within 0 to 6 Hz. The cutoff frequency that I chose was 6 Hz. I chose this value because it would filter out the noise without distorting or losing the data that I want. From this, I calculated an alpha value of 0.25. After applying the low pass filter, I was able to obtain a less noisy signal.
Low Pass Filter on Pitch:
Low Pass Filter on Roll:
Gyroscope
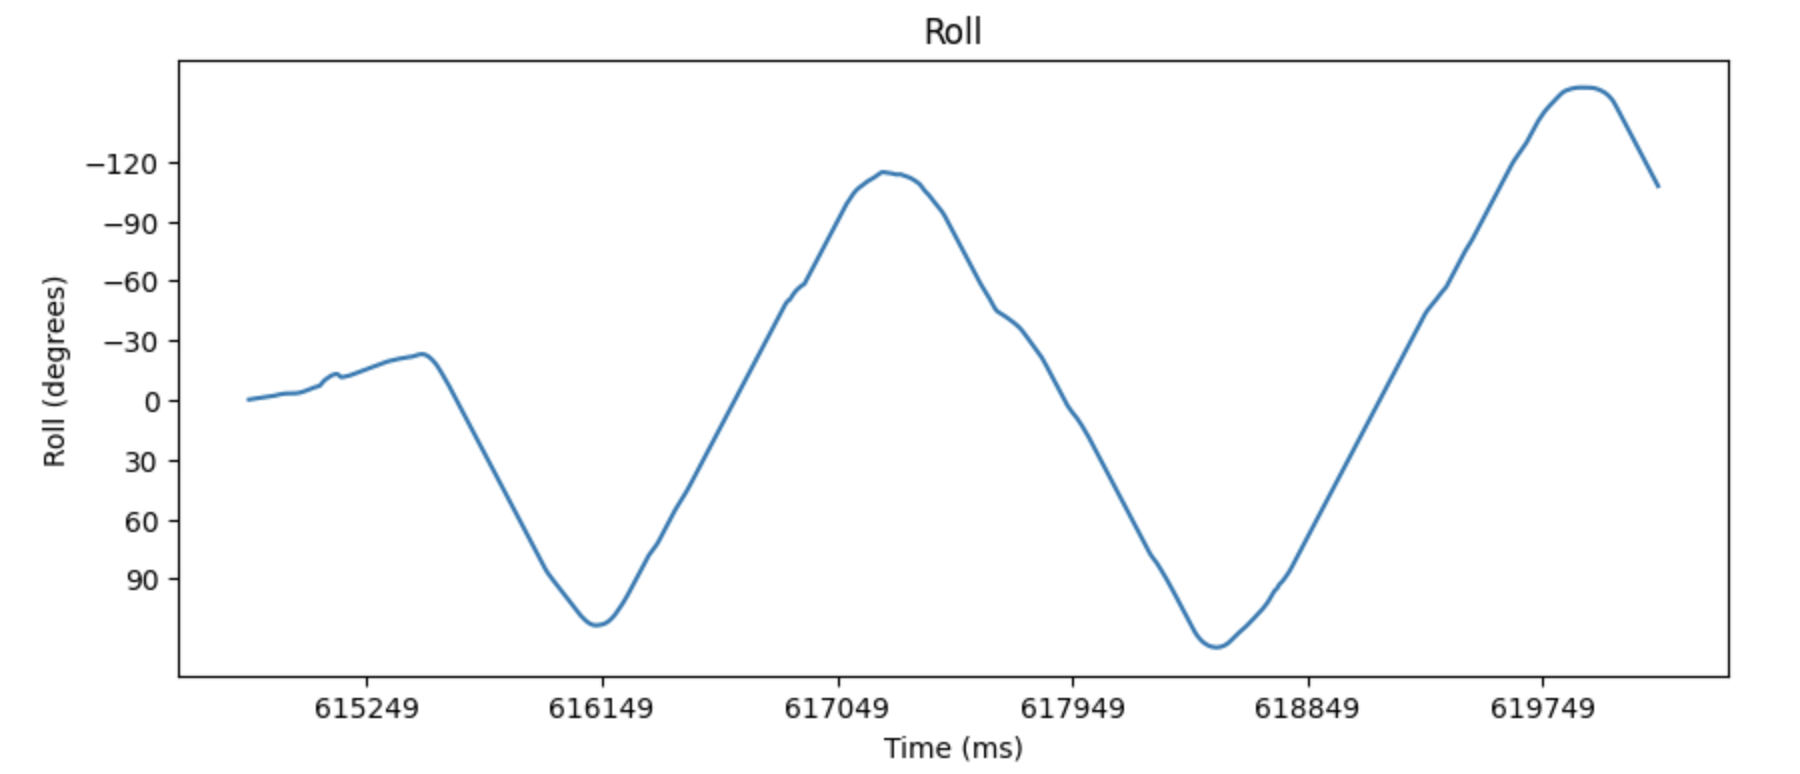
For the gyroscope, I followed a similar process to calculate and send the roll, pitch, and yaw data over bluetooth.
Roll, Pitch, Yaw
I implemented it in a command called SEND_GYR_DATA.
dt = (millis()-lastT)/1000;
lastT = millis();

g_time_array[i] = lastT;
g_roll_array[i] = g_roll_array[i-1] + myICM.gyrX() * dt;
g_pitch_array[i] = g_pitch_array[i-1] + myICM.gyrY() * dt;
g_yaw_array[i] = g_yaw_array[i-1] + myICM.gyrZ() * dt;
Roll:
Pitch:
Yaw:
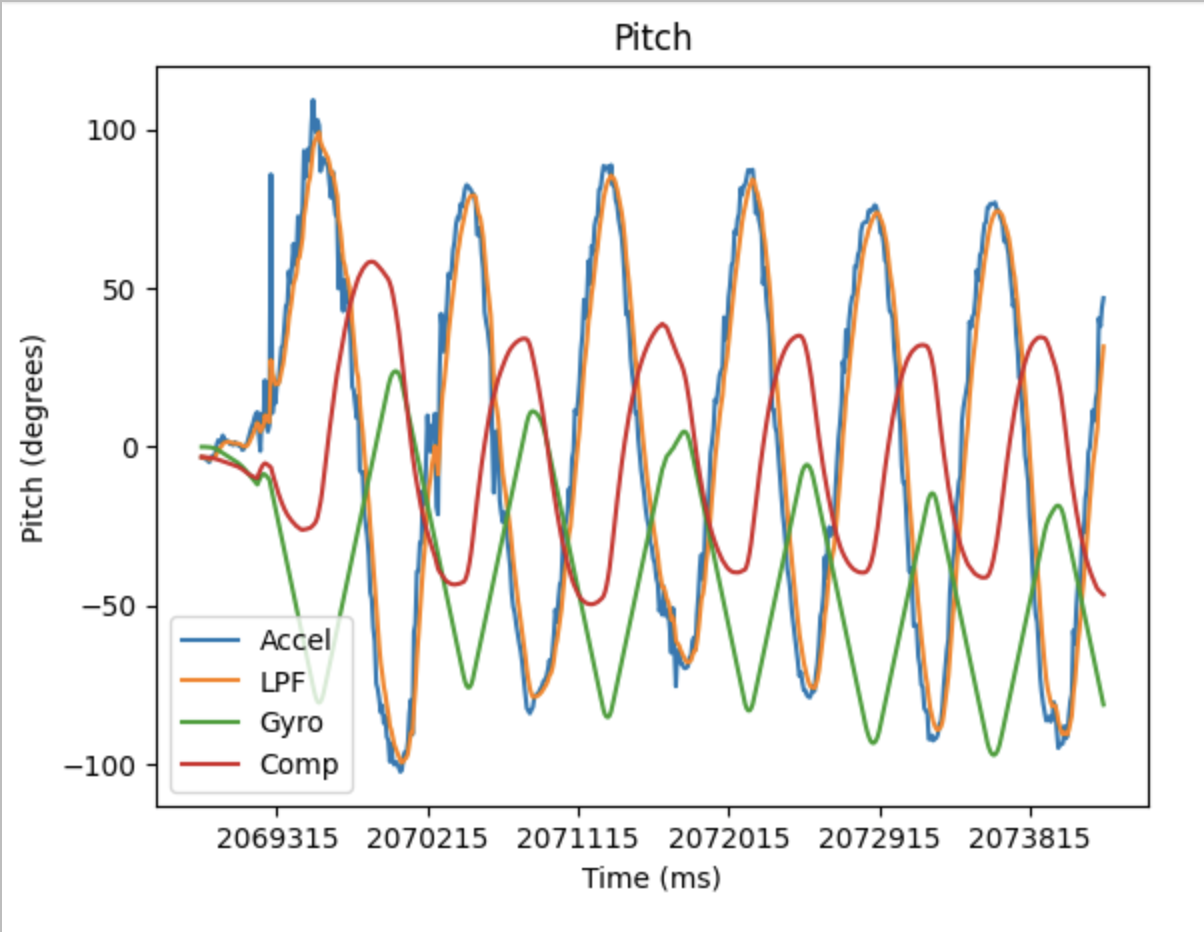
The results had less noise, but more drift than the accelerometer readings.
Complementary filter
Since there’s advantages and tradeoffs between accelerometer and gyroscope data, a complementary filter can use a mix of both to create a better signal.
Sampling Data
After speeding up the execution of my main loop I was able to sample data at 112 values/second. I stored my data in separate arrays for roll, pitch, yaw, and time. I also had separate arrays for accelerometer and gyroscope readings. This is better because it allows me to only send what I need without iterating through a large array. Most of my data was stored as floats because it’s more precise and makes calculations easier.
Stunt
The car was pretty responsive to the remote and took a few seconds to get to full speed. The forward/backward and left/right controls can be used together to do different turns. It can also spin in place without much displacement. To flip it, I drove it forward very quickly and changed direction.